Introductions
Railmetrics is an analytics application that uses live metrics and data to help users explore, interpret, and predict the state of commuting in our highly connected technology-focused world. Railmetrics works as a standalone service that corporations can license for use. Data collected from employees and public transit services are filtered into the application and displayed as live metrics, ready to be used to create predictions for future trends or changes to current systems. The application is designed to combat issues with traffic originating from mass commuting, work efficiency, and employee wellbeing.
Initial Questions
When I first began conceptualizing my project, I began asking questions that I wanted to solve. One of these was “How do we solve traffic and pollution in Washington State.” This issue is familiar to me, since I have many times had to commute to work in incredible local traffic. The delays that I encountered didn’t annoy me but caused me to wonder about the sheer pollution and unnecessary carbon footprint created by the cars at a standstill.
Persona
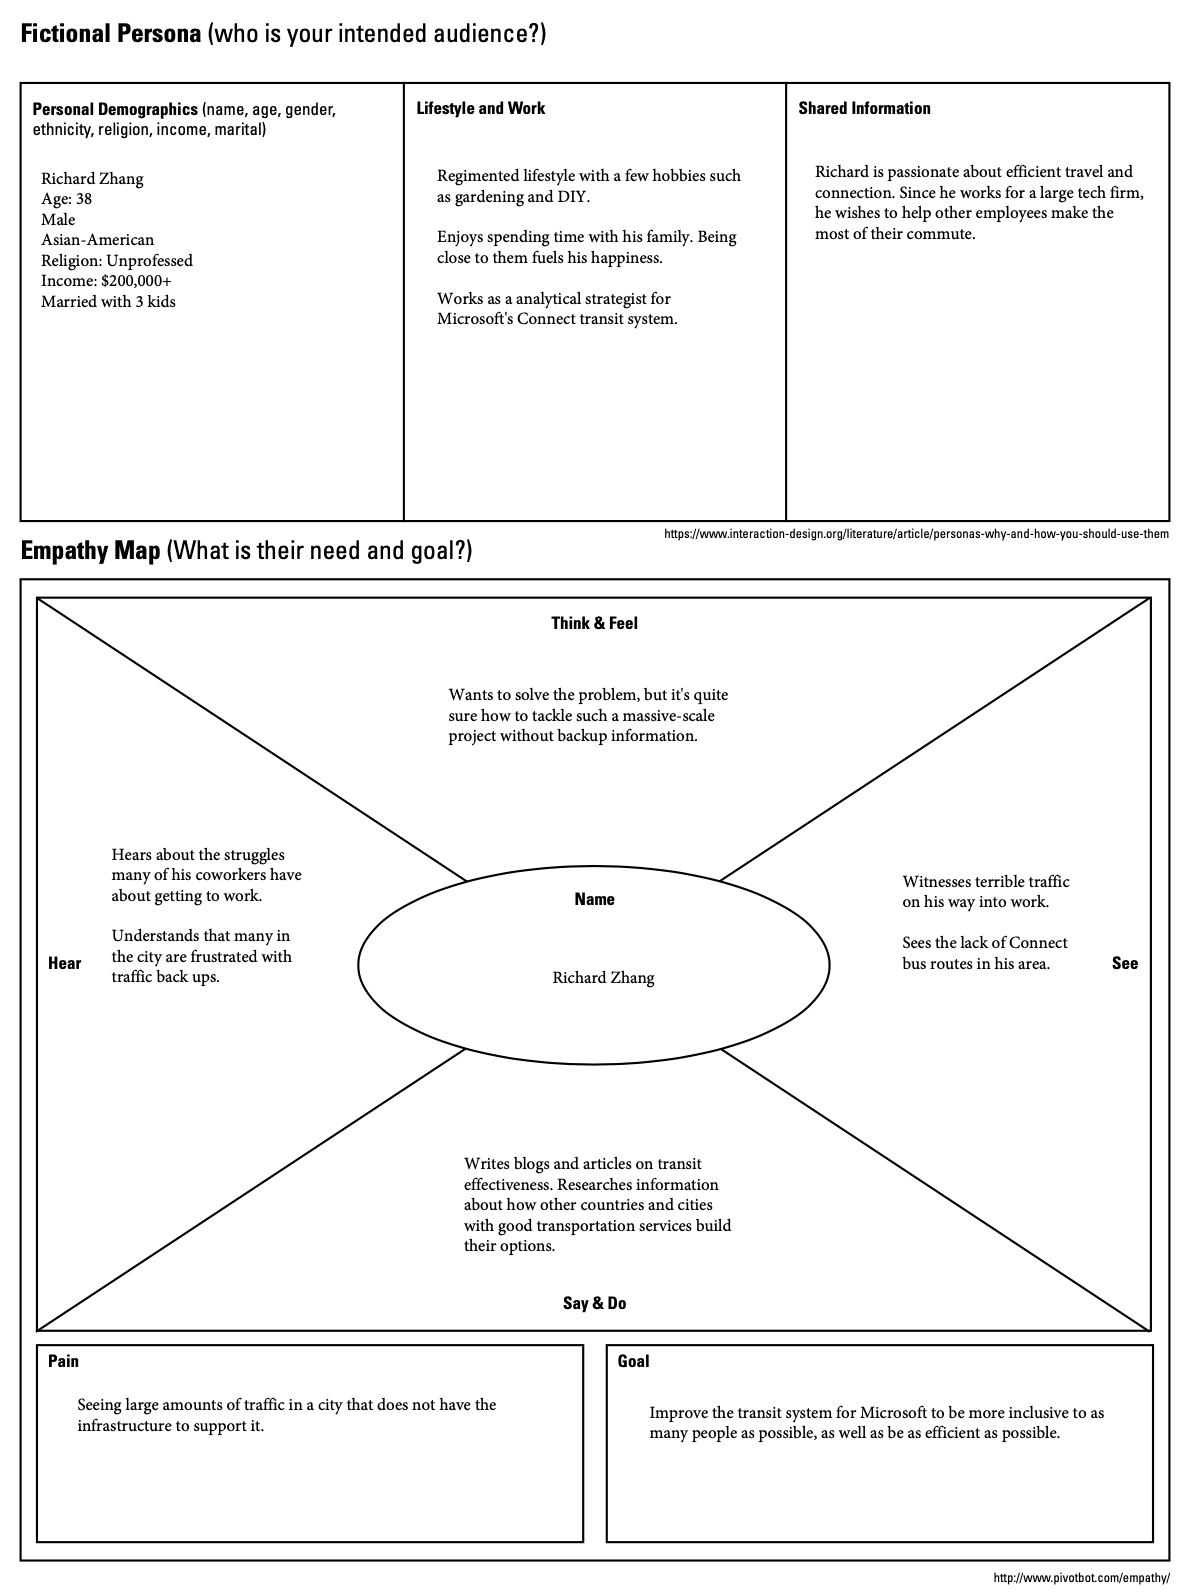
The next step of my process was to create a persona to build my solution upon. This person would represent the corporate lead in charge of transit services at a company. I defined this person in such a way that he also would have experience sitting in traffic, as I wanted there to be a sense of empathy in his work.
Research
During my research I encountered many sites where residents of King County attempted to solve traffic local traffic issues. The most common solutions proposed were to build new roads or divert existing ones. Some even suggested widening roads to allow for more traffic to pass through. Another interesting article mentioned that even those running for political office run on the basis that they will attempt to fix traffic issues in the state. Yet another article outlined the condition Washington State traffic is in.
“INRIX, The Kirkland-based traffic data company, has released its annual traffic scorecard. Seattle came in No. 20 for traffic congestion on a list of the 25 largest cities on Earth, beating out much bigger cities like Saint Petersburg and Rio de Janeiro. In North America, Seattle ranks 9th worst, and Tacoma is 18th worst, according to INRIX. In 2017, the average driver spent 55 hours sitting in congestion, and 12 percent of all driving time was spent in congestion. Tacoma was not much better with drivers spending 41 hours in traffic in 2017 and 11 percent of all driving time. “
Suggestion
It is based on articles and opinions like these that I built my idea. When I looked at these views, I realized that everyone was looking at the problem the same way. Everyone assumed that all traffic issues stemmed from the roads themselves. They were either “too small, too few, incorrectly placed, poorly maintained” and etc. I believe that the purpose of being a designer is to look beyond the face value of an issue and try to understand the wicked problem that lays its foundation. I decided to view the problem as a commuter problem, not an infrastructure problem.
Stating the Problem
Traffic and congestion are at an all-time high in Washington State. Current approaches through modifying infrastructure prove to be ineffective. This fact hints that an alternative solution is required. Long commutes hurt workplace efficiency and are negative on employee wellbeing.
The Solution
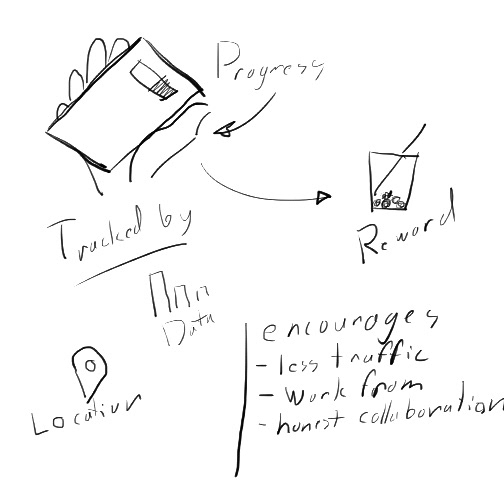
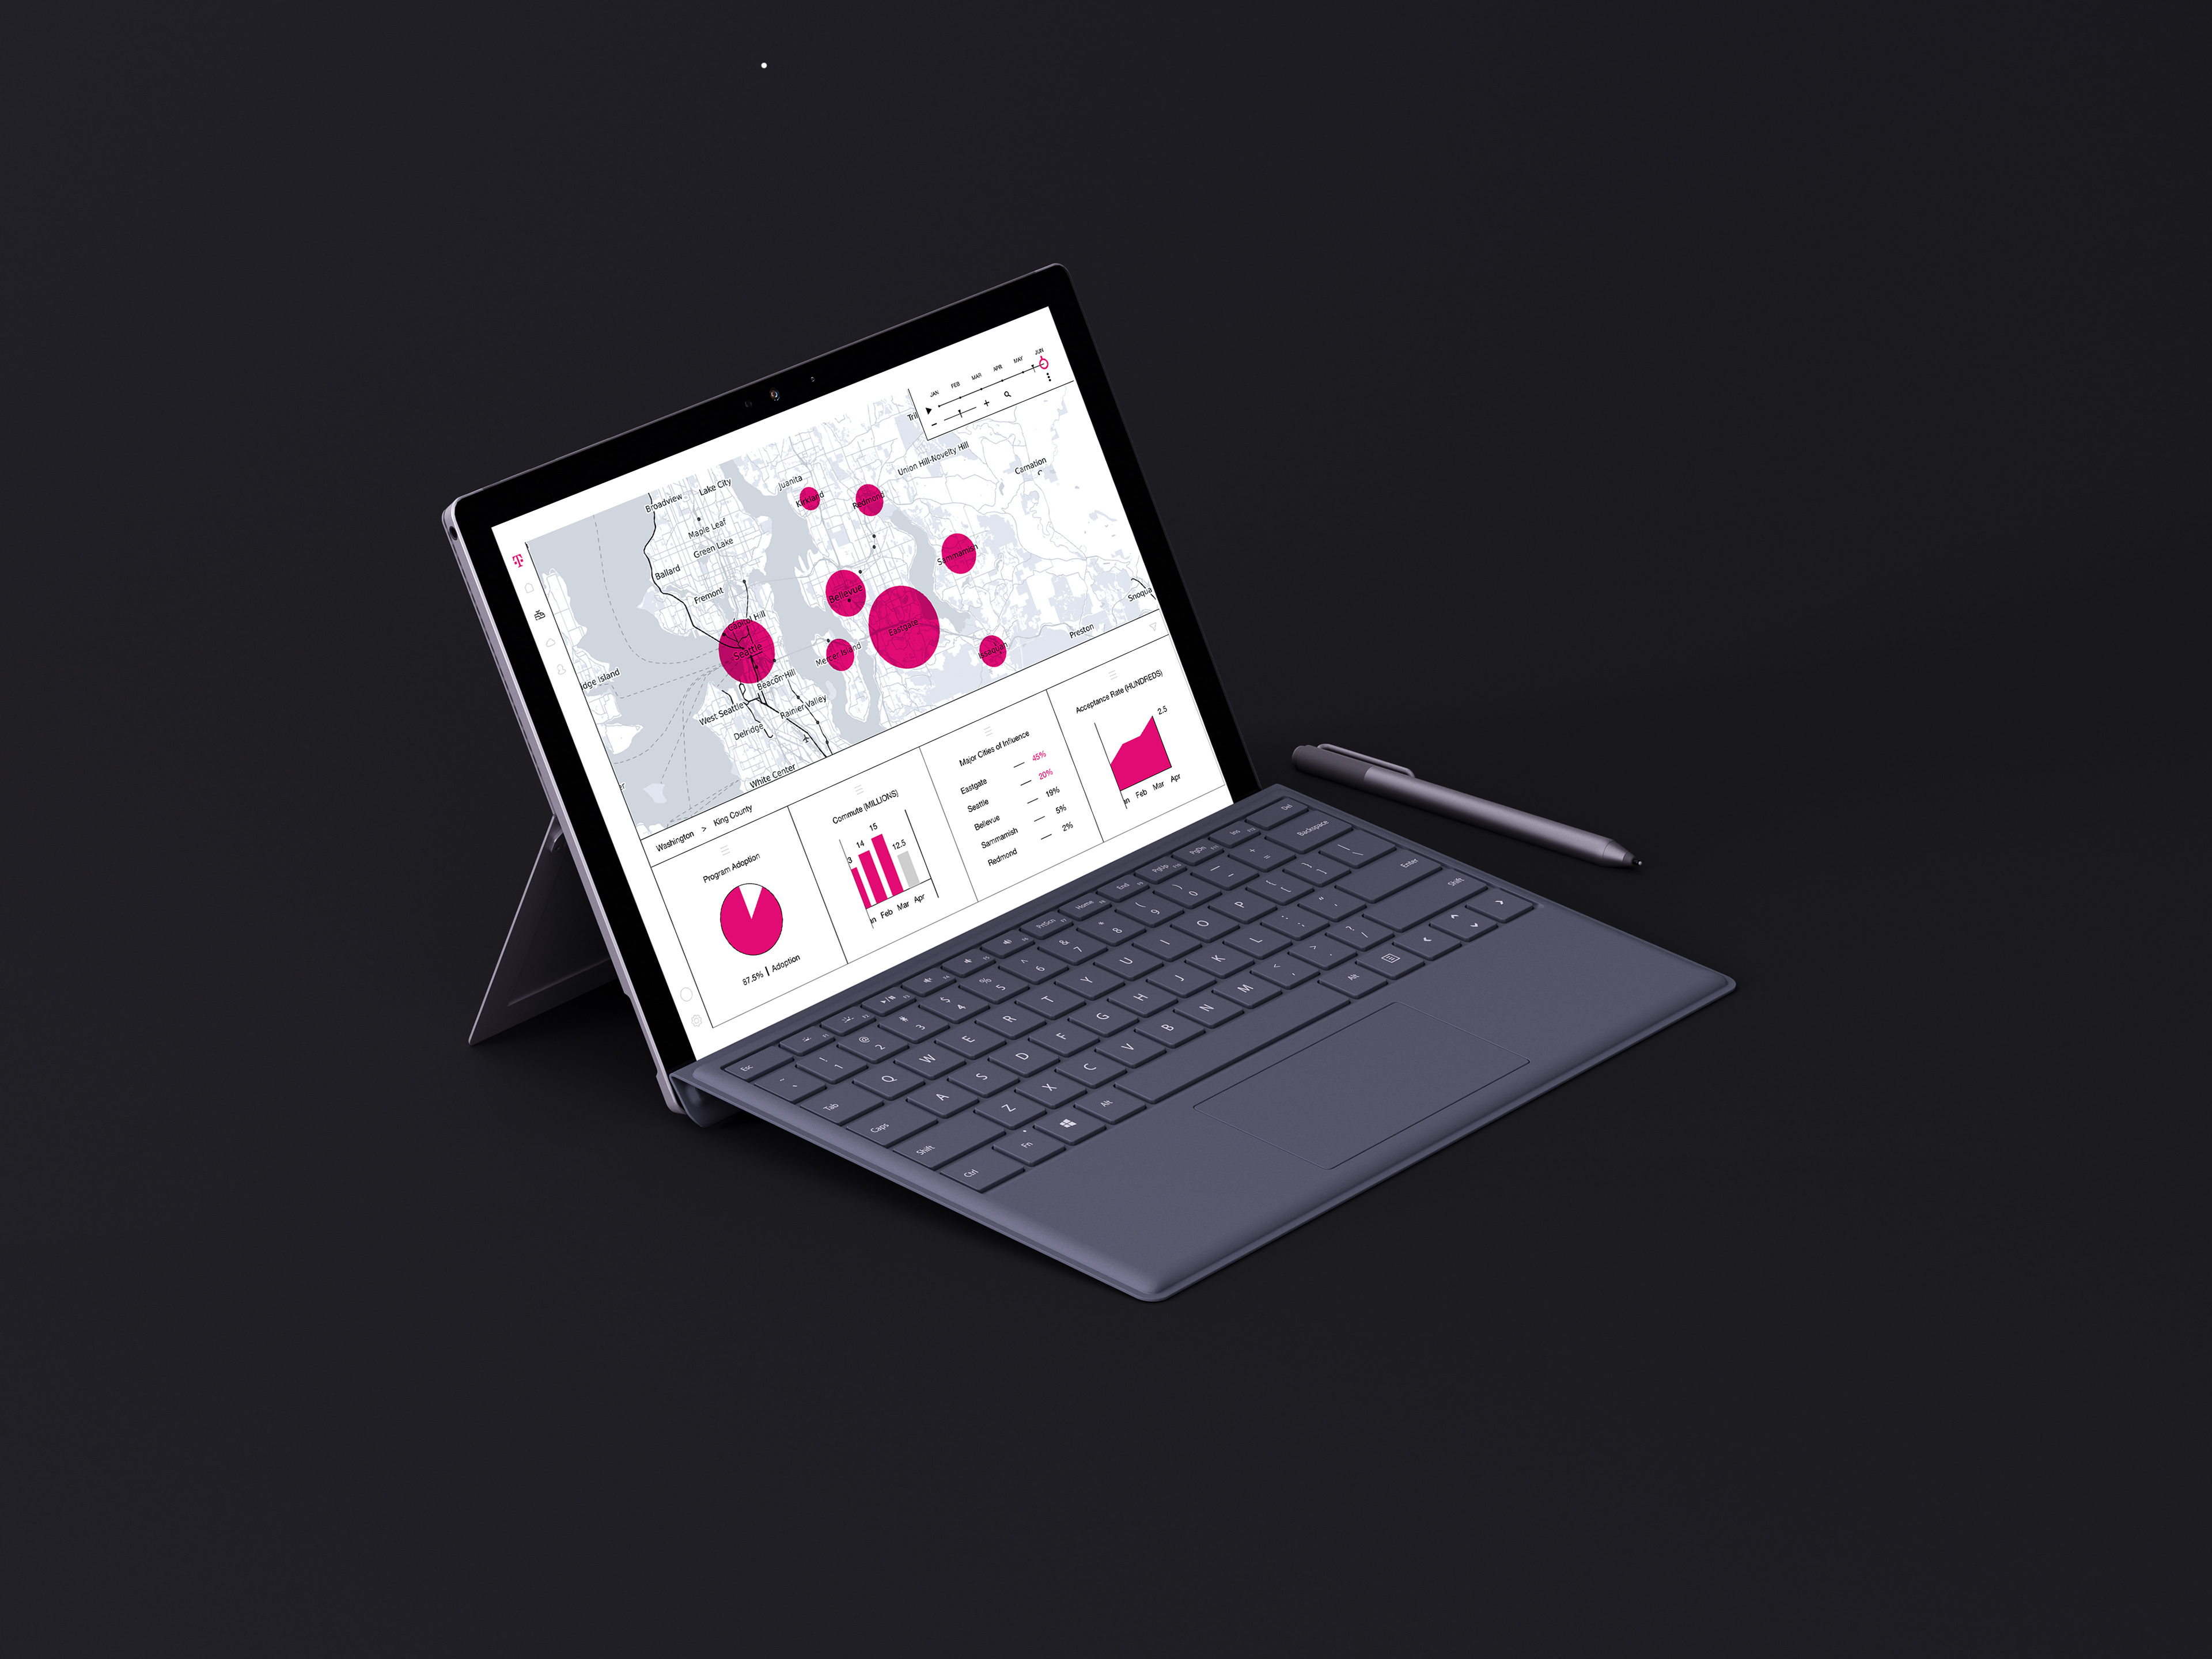
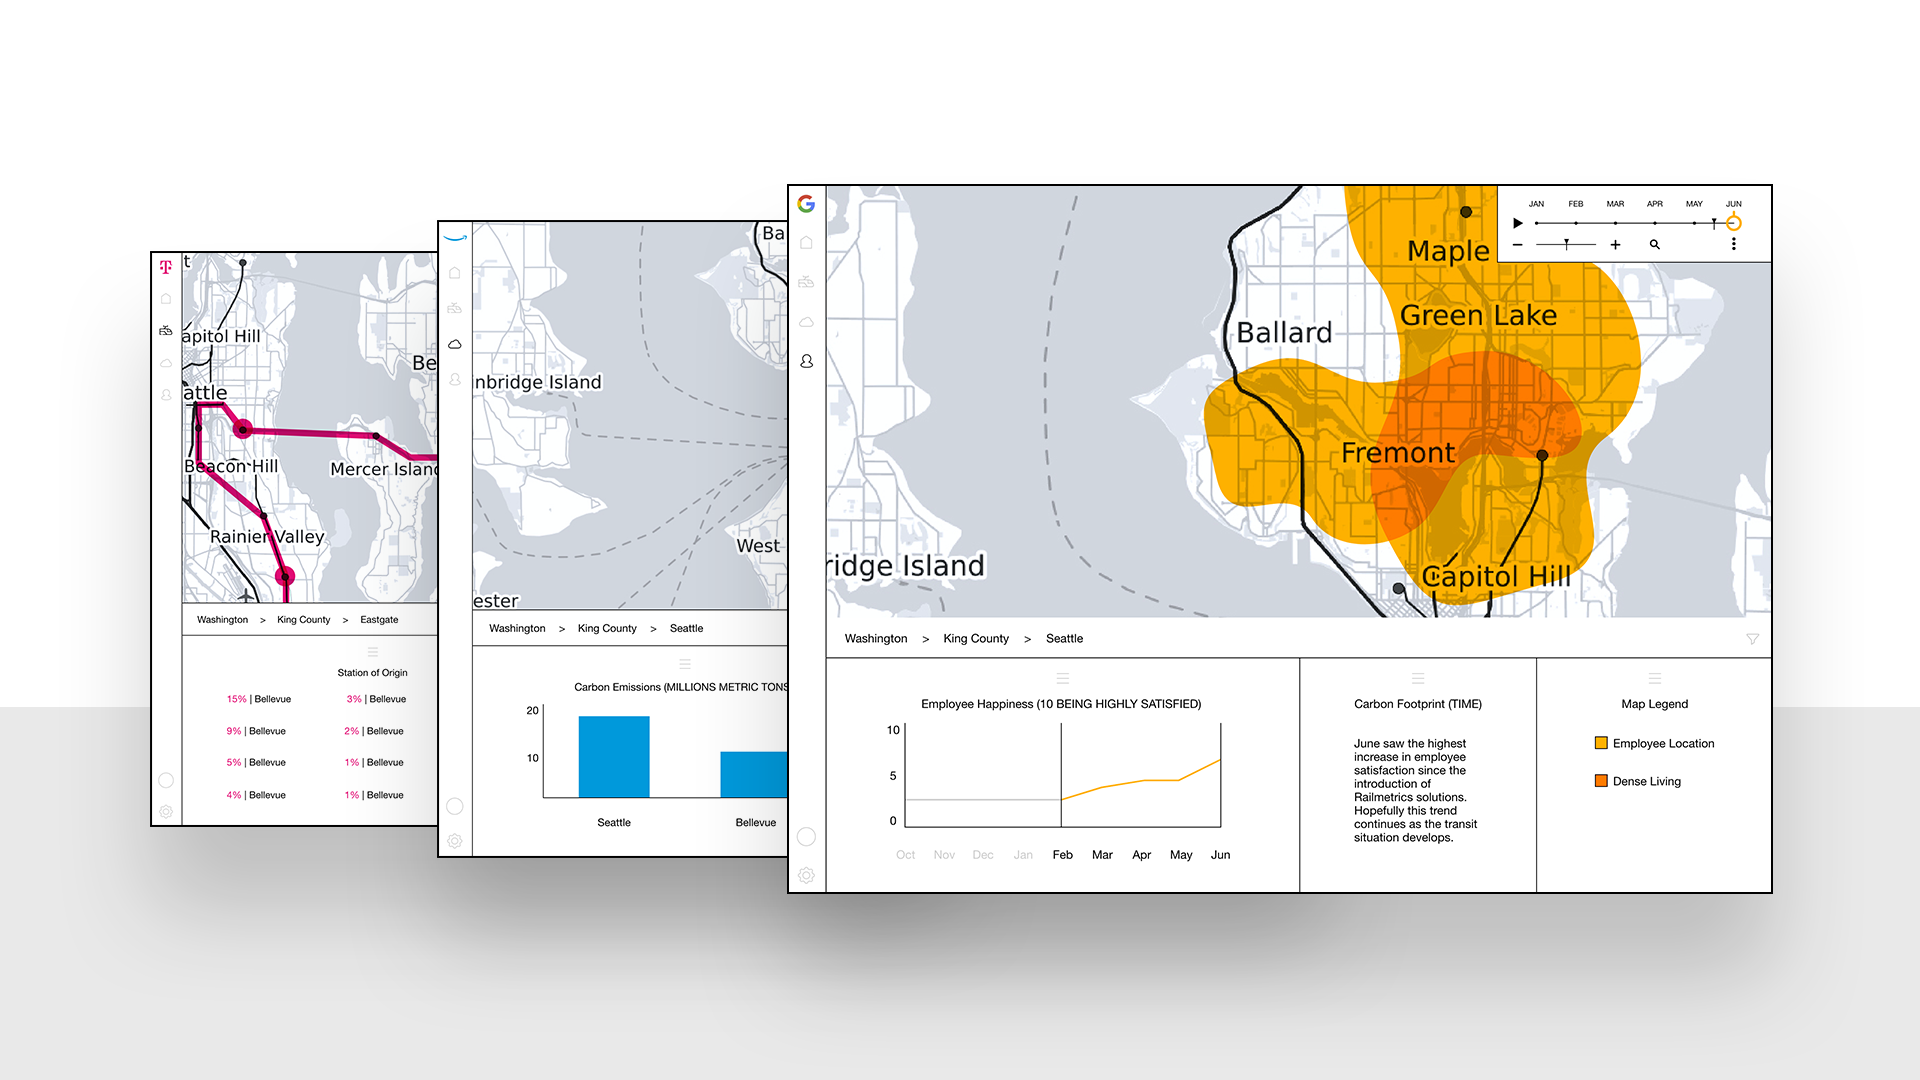
To address the traffic issue, I created an application that measures traffic and transit analytics and cross-references the data to metrics measuring employee wellbeing and work output.

The Proposed Outcome
I hope corporations will be able to use my application to provide a variety of solutions to their employees. The first option I would like to see is companies staggering employee in-office worktime. This means not all employees would be required to commute to the office at once. Some would be allowed to work from home, while those who need to use the office space can make use of the facilities. This not only would reduce traffic on the road, but also reduce the carbon footprint the company’s building upkeep would create.
The second option would be for companies to adjust their sponsored transit options to their employees. Whether this takes the form of more benefits for riding transit or better options to take, I think it would be optimal to get the largest number of employees on transit as possible. With the new light rail under construction in King County, it is the perfect time to start transitioning the workforce into more efficient means of transport. Companies could adjust pickup stops or designate more resources to employee ride-sharing options based on live data.
Human Centered Design
This entire project was designed to be approached from a user centered point of a view. This solution is meant to help people, and it does so by relying upon empathy from those at the company. The user of my project is involved because he or she wants to improve the lives of those under them. In larger corporations, changes to services provided to employs can only be approved through use of hard data and evidence that they will indeed bring about positive change. The data my app presents is the perfect example of the evidence such a corporation would need.
Reflection
After creating this app, I look back at my research and long to come at the project again with more time and more effort. The limited scope of the class hindered my work, and I hope to recreate the project with even more detail.